What is Big Data Analytics, As We See It For Pulp and Paper?
When industry became digital with the advent of the 3rd industrial revolution approximately 50 years ago, digital data began to proliferate and accumulate. With all of this industrial data, it is challenging to analyze it to turn it into useful information; thus, the devil is in the data.
As we progress through the 4th industrial era, industrial data has expanded outside the walls of our facilities. Internet connectivity has enabled Big Data, which is defined in the TAPPI’s Industry 4.0 Lexicon (TIP 1103-04) as consisting of:
- Data Volume: Refers to the amount of the data and can include both unstructured and structured data. The volume of data is an arbitrary measure with ranges ranging from tens of terabytes to hundreds of petabytes, depending on the context.
- Data Variety: Refers to the different types of data from more than one source (DCS, IIoT / Edge devices, QCS, weather, digital log, different process equipment, locations, etc.)
- Data Velocity: Data that is not only acquired quickly but also processed and can be utilized faster.
- Data Veracity: Refers to the data quality; the biases, noise, and abnormalities within the data sets must be removed. Big Data must have preprocessed (cleaned) data representing what we want to use it for.
The mountain of industrial data continues to grow. With the right tools, the mountain can be mined for gold. As a kickoff to our “The Devil is in the Data Series,” this article describes the attributes of tools for analyzing big data.
The Data Growth Trend Is Not Slowing Down.
The value of data is talked about a lot. It is very likely that nearly every aspect of our daily routine generates data or is affected by some form of data analytics. So, the answer must be, “We are doing everything we can to maximize the value of data.”
Then the follow-up question must be, “How?”
Over the last 20 years, there has been an explosion in data, particularly in business and decision-making, as requests like “show me the data” or “let’s look at the data” reflect how commonplace this has become. This “demand” for data has resulted in a myriad of devices, efforts, processes, and strategies for generating, capturing, and working (sometimes struggling) with data to find that “ah ha” moment or insight, which we then can equate to a value.
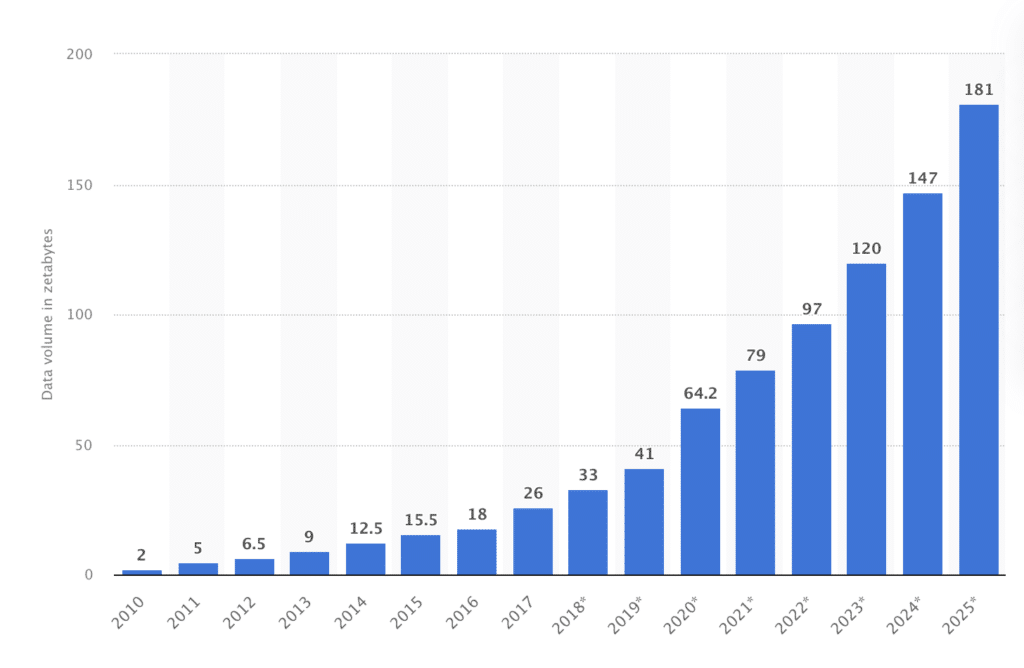
To give this data demand some context, the chart below provides one perspective of historical estimates and forecasts of data growth.
© Statista 2022
What this chart represents and shows:
- Data volume growth has seen annual changes like 30%, 40%, and upwards to nearly 60% historically.
- Is it conservative to forecast just 23%/a of continued growth?
The Amount Of Data Isn’t Always The Issue, But Rather the Ability To Interpret It.
Data is changing and becoming more enriched as we develop new ways of generating, capturing, and working with it to develop the story it is telling us and seeking insights.
And as we derive our insights, we often redefine the value of data within our businesses as new understandings are developed, and applications are employed. Tim Nicholls, CFO at International Paper, provided his thoughts on leveraging disruptive processes in a Wall Street Journal article indicating:
Technology is helping us improve our business model, processes, customer interactions, and much more. Access to large amounts of data has increased our capabilities for decision-making at every level of the organization. At IP, we have built cross-functional teams using advanced analytics to identify patterns and streamline operations. Our teams take the opportunities presented to us through advanced analytics and find ways to create unique value, with the ultimate goal of bringing scalable solutions to the enterprise.
And International Paper is not alone in recognizing data’s changing value and complexity. Throughout the industry, investments to turn data into “gold” proliferate. It is not achieved via alchemy. It is through teamwork and advanced data analytics.
Yet, as rapid and explosive as data growth has been, this has resulted in differing interpretations of data analytics. Many vendors sell solutions along these lines, but they can have very different features and functions.
Fortunately, efforts to agree upon a common language to align everyone has been made with TAPPI’s Industry 4.0 Lexicon (TIP 1103-04). In short, the attributes of a data analytics solution are:
- Micro in scope (seeks to answer a defined question to produce improvements)
- Uses Big Data
The 5 Key Steps For Successful Big Data Analytics In Mills.
Ideally, a data analytics solution would be flexible enough to deal with the myriad ways data is captured and stored and utilize its users’ creativity supported by numerous analytic techniques. Simply, there are five criteria I focus on for success that include:
- Connectivity
- Visualization
- Pre-processing
- Analysis
- Collaboration
Some data analytics solutions fill a particular niche or deliver a subset of the items listed above. Still, we should be mindful of reviewing solutions that promote flexible and scalable attributes to adapt to our changing data needs.
As some may interpret my criteria differently, I will explain each separately.
1. Connectivity
What is it?
Connectivity is the ability to access data from a variety of sources.
Challenges With Current Connectivity
- Data originates from many sources.
- Most commonly in industry, data is stored as time series in a historian. A single historian may consolidate data from several control systems or digital devices.
- In our industry, we also have QCS systems which may be an independent data source.
- We also have lab data that could end up in SQL tables.
- We may need to load data from Excel.
- We could also have multiples of the above in a facility and across an enterprise.
What’s Needed
A data analytics solution must make a connection to these data sources possible and directly. Ideally, we want real-time data to see changes as they occur.
This is why an attribute listed in the Industry 4.0 Lexicon is Big Data. The Lexicon defines Big Data to include various data sources as attributes. A data analytics solution needs connectivity to big data.
2. Visualization
What is it?
Visualization is the ability of a user to understand how data becomes valuable information.
Challenges
It is hard to analyze data you can’t see, and you can often begin quickly to identify problems with a dataset, like missing values, just by visualizing it. However, the volume of data we typically generate in the industry cannot be comprehended by looking at it point by point. Traditional desktop tools we commonly use are not meant to handle the volume of data that needs to be analyzed today.
For example, if you stored six months of data for a single sensor in Excel in a row at a 1-second frequency, that would require 15,552,000 rows. Now consider how quickly the data set expands when adding the next series and the next. Visualizing all that data requires a complete toolbox of techniques to make it manageable and counterbalance the amount of time we have available to work with it and review it.
What’s Needed
Many of us in process industries are accustomed to seeing time series trends, but that alone is insufficient for discerning what all the data is telling you. It requires tools that can organize and relate data into a presentation that reveals answers and lead to insights.
3. Pre-processing
What Is It?
Pre-processing means identifying the significant and valuable data and removing misleading or not applicable data.
Challenge
Not all data is good data. Tools must be used to identify and remove inadequate or irrelevant data to be helpful. Making this point by point is practically impossible.
What’s Needed
Data analytics solutions need a rich set of filtering and condition detection tools. These tools ideally should allow application data cleansing in a comprehensive way and have easy methods to align datasets regardless of the timeframe of interest.
4. Analysis
What is it?
Once we have pre-processed the data to yield a valid dataset, analysis tools can find correlations that yield answers. Prediction models can be built to show what will happen under different conditions. Statistical techniques show whether there is a valid cause-and-effect relationship.
Challenges
There is a multitude of techniques for analyzing data. Some may even be specific to a process at your facility or have been developed in-house. However, balancing the analytic tools needed and available today versus what might be available in the future is always difficult to assess from any provider. This is just the reality for any solution.
We often need to update analyses, so I will be mindful of this as we evaluate solutions. New values, accounting for process changes, and reviewing other timeframes are all typical drivers for updating analyses to determine if the data is telling us the same; or, possibly, a different story with new insights.
Additionally, replicating or scaling it across numerous other assets can take a lot of resources if the analytics work well, depending on the solution or combination of solutions required. So, I always have this aspect in the back of my mind.
What’s Needed
A good data analytics solution should offer various tools and be flexible to adapt to your specific needs.
5. Collaboration
What Is It?
Data analytics today is a team effort. Nowadays, it can take a team to tackle the pre-processing and analysis efforts involving operators, engineers, SMEs, and data scientists. Further, data analytics results aren’t helpful unless they can be shared with the right people.
Challenges
Data analytics today is a team effort. Nowadays, it can take a team to tackle the pre-processing and analysis efforts involving operators, engineers, SMEs, and data scientists. Further, data analytics results aren’t helpful unless they can be shared with the right people.
What’s Needed
Fostering a collaborative environment for doing the work and sharing the results to understand the analysis audit trail is vital (ensures everyone has the current version instead of hunting for files through emails, hard drives, or file shares…). The assumptions and decisions made when developing an analysis directly impact the story the data can tell, making it so critically important in analytics. Efficiently aligning and updating the team and stakeholders only hasten efforts to identify those insights and take action to begin producing the “gold” I spoke about previously.
In closing
If these criteria are addressed, then I have seen numerous instances of success. I was introduced to Seeq® several years ago while supporting a customer and have found it to be my preferred application for advanced analytics. This is also partly why we use it in our DataSolve™ offering today. But whatever solution you are currently engaged with, I would highly recommend reviewing it against my criteria for success to see if you could make your life a little bit easier. On that note, a companion series to our blog is developing, highlighting use cases that we believe will help you.


