Challenge – Producing Premium Stock
A Midwestern P&P mill that produces high-end white paper grades, as well as brightly colored stock, took on a new customer that required an even high-quality product for glossy annual reports. Their early attempts to produce this premium stock indicated their existing test methods to detect dirt and shives weren’t sensitive enough to meet this new specification. Specifically, bleach plant operators could not detect the small dirt particles now considered unacceptable.
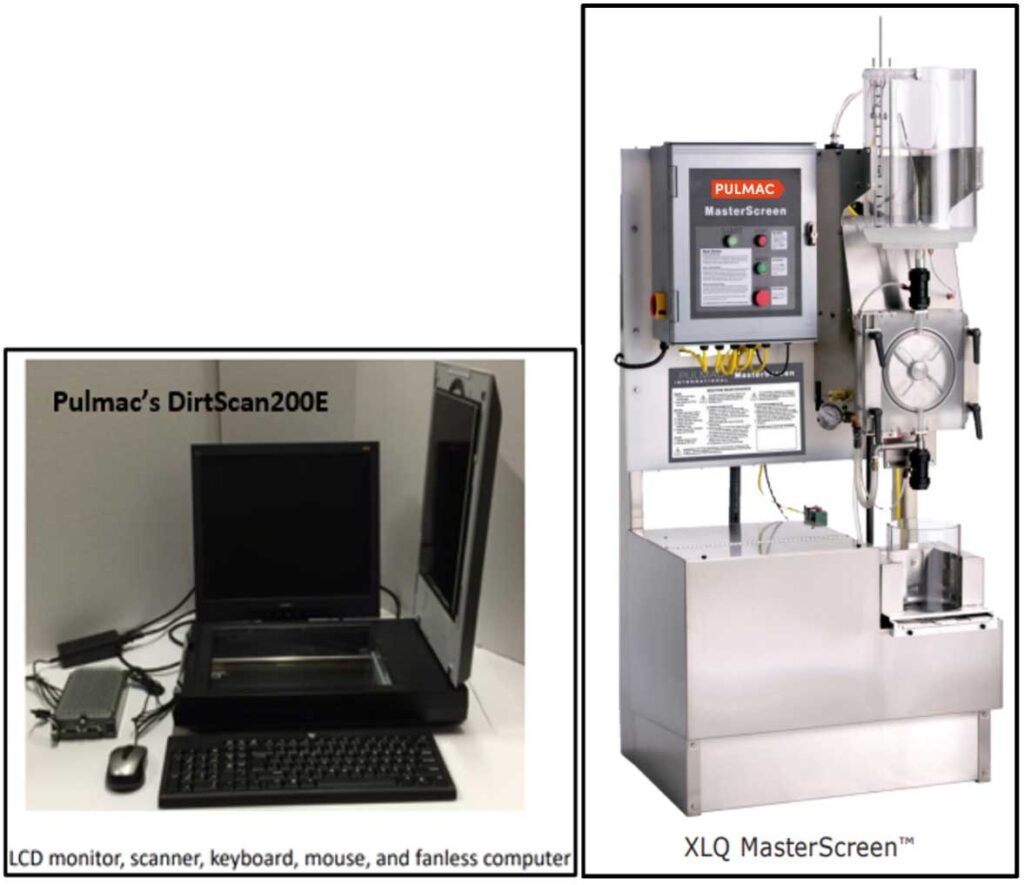
To address this challenge, mill personnel researched where their existing test methods weren’t detecting the dirt issues in their pulping and bleaching process. By chance, the mill was using a Pulmac MasterScreenTM and an older Shive Analyzer, but no Dirt Analyzer. Mill personnel experimented with using the MasterScreen and Shive Analyzer and found that this provided good repeatable results. So, when mill personnel reached out to Pulmac and explained their situation, it was concluded that their MasterScreenTM was fine and that Pulmac’s DirtScanTM unit would work well for this challenge. Mill personnel then initiated a capital request to add a dirt scanner.
Solution – DirtScan + MasterScreen
Once the new Dirt Scan instrument was installed and calibrated, mill personnel embarked on a strenuous exercise to uncover what and where this dirt came from.
Once a pulp sample is collected (approximately 50 grams of oven-dried equivalent pulp stock), the instrument automatically provides water into the feed tank, loads it to a fill level, shuts off the water, an air mixer kicks in, then the operator pours the pulp slurry stock into the top of the MasterScreen.
At this point, the operator can leave the MasterScreen as it operates on its own and preps the sample in under 12 minutes.
- It filters the dirt particles and then deposits them onto an 8-inch diameter filter pad.
- That pad is then dried and placed on the dirt scanner (dirt side facing the scanner), where scanning takes roughly 60-seconds.
- A dedicated computer handles the scanning sequence, imaging analysis, and data reporting functions.
- The operator selects the sample identification tag from a drop-down list and then clicks on a button to start the scan.
- The software analyzes the scan and displays several parameters such as total dirt count, the total area of dirt particles, and average particle size. A reference test sheet is also available to verify the calibration of the scanner.
- Data from all tests are presented to the operator via the monitor and stored on the hard drive.
Operators take pulp samples every other hour at the first stage of the bleaching process and every hour at the last stage of the bleaching process and from the high-density storage tank. Taking samples at these different stages of the pulping process is designed to provide early warning of the presence of dirt, and to help troubleshoot the process.
Results Up to 120% Increase in IRR
Through this process, it was determined that the cause of the dirt was the yellowish inner bark of a particular tree species that caused most of the problems. Because the analyzer physically separates the dirt from the pulp sample, it is much easier to troubleshoot the process. Experience from visual inspection of dirt pads has led to quick identification of process problems. Characteristic types of dirt can point to problems in the chip plant, brownstock cleaning and screening areas, or within the bleach plant. The ability of the analyzer to handle larger sample sizes has also improved the reliability of the test. Information provided by the dirt analyzer has also helped the mill to make substantial improvements by identifying problems that had been difficult to isolate in the past. For example, improved testing helped to confirm that a particular wood species was responsible for most of the bark carryover issue. This provided justification to change the wood purchase specification. Intermittent bark carryover issues were spotted sooner, allowing improved communication to the chip plant operators. Issues in the screen room have been detected earlier by seeing the characteristic dirt on the pads in the first bleaching stage.
Savings attributed to avoiding culled paper were in the order of $100,000/yr. By being able to detect dirt at much finer levels, the mill made major strides towards eliminating it from their chipping and pulping processes. From an internal rate of return, calculations provide an approximate IRR. Note that the mill already had a MasterScreen. Thus, this facility had a higher IRR than noted below.
This investment proposal assumes no MasterScreen or Dirt Scanner was available. Further, here is a handy financial equation that all companies use as the basis for calculations on their investments. While this formula is the most basic of financial calculators, every company uses its own Financial Calculator that can adjust for a number of factors (e.g., How long to allow the EBITDA benefits to extend; Special Tax situations, etc.) This is intended to provide a ballpark value only on an IRR.
Basic financial formula:
IRR = (Annual EBITDA) * (0.72) / (Total Installed Costs)
Where: Annual EBITDA = $100,000 per year (200 tons/yr rejected @ $500/ton)
0.72 = Removes Taxes, Interest, etc. (Based on Rule of 72)
Total Installed Costs = $60,000 (Cost of a MasterScreen and DirtScanTM Analyzer)
Typical IRR Troubleshooting Dirt/Shives in Pulp Mill
IRR = EBITDA*0.72/Total Installed Cost
= ($100K/yr. * 0.72) / $60K = ~120% IRR

