Safety Data & Troubleshooting Working Together
Safety is at the forefront of our daily lives, or it should be. Those who work in industrial settings know well what can happen when we stop being proactive about safety. While unexpected events and downtime occur, our safety training helps us respond appropriately. And a critical aspect of a good safety program is the investigation process after an event. This process seeks to document and to identify root causes to prevent the incident from occurring again. The outcome often recommends controls or other corrective actions, but what happens when the issue keeps reoccurring? A benefit of safety investigations is they can also generate a good deal of data.
Here, we will discuss how one team uses that data to address fires in their dryers.
Dryer Fires
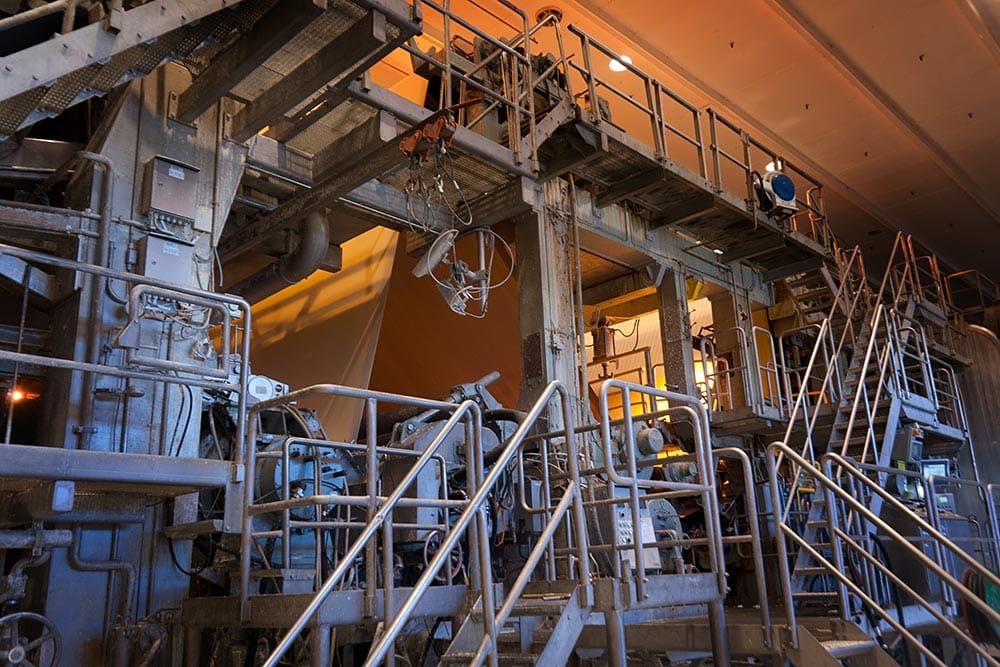
Good housekeeping practices go hand in hand with good safety practices. Having a well-lit area and performing regular washups go a long way in spotting trouble before it starts. However, the reality in papermaking is we must dry our product – and paper, when it gets too hot, burns. But for this team in question, their initial thought for a fire was that housekeeping practices were to blame. The location was high in the framing and challenging to reach with the hood panels. In addition, the grade run beforehand had issues with several breaks sending scrap everywhere.
While the machine had a quick cleanup, the fire was chalked up to not completing the washup properly, believing that some paper remnants were ignited.
What happens when the safety issue returns?
Several weeks passed, and another fire was reported. This time, a different crew was working. Again, the safety investigation proceeded, and the conclusion was the same; washup practices in the dryer area were not being completed properly. To address the situation, a reminder was sent to all the crew leads to review washup procedures with their team, ensure they were being followed, and perform a quick inspection themselves. By the time the third fire occurred not long afterward, the team had begun to suspect something else had to be the cause.
Having three fires in two months did not make sense for a machine that might have two fires a year. Washups had been reinforced, and the crews were triple checking that no scraps were left in the framing to provide an easy fuel source for fires.
Maybe things aren’t as they appear?
The issue was elevated to engineering for review. As they began their process, the documentation and data from the prior safety investigations outlined the event times and statements collected, pertinent entries from the logs, and photos taken from the inspections. No significant damage to the area was identified or otherwise noted as out of the ordinary. Setpoints were confirmed to be correct, and nothing appeared to be wrong with the controls.
As engineering continued investigating, several more fires occurred in the following weeks. More requests for information were made of the crews, additional process data compiled, and the timeframe before a fire was increased to review. With more and more data points needing to be checked, the effort was moved into a Seeq® Workbench to aid in consolidating the data from the various systems and documenting completed analyses.
The journal capability enabled efficient auditing of multiple analyses and noting what had and hadn’t been checked for review. Up to this point:
- There was no identifiable commonality among the incidents.
- All the crews had experienced at least one fire on their shift.
- The fires had occurred in many of the assigned grades.
- The time of day did not matter.
- The time between washups didn’t matter either.
Can machine data “lie” to us?
After a few months, performance was taking a hit as operations anticipated almost 20 fires for the year if they couldn’t resolve this. With each fire, the machine was incurring about an hour of downtime, which equated to about $15,000 / hour, and was a safety issue that needed to be addressed. While more fires were not wanted, they allowed for more data to be incorporated into engineering’s review to identify the root cause.
The Problem
Meanwhile, additional people were assigned and tasked with walking down the machine during production runs along with the crew lead after each fire to ensure they were not missing something in reporting or losing evidence in the fire itself. With still no luck identifying the root cause, engineering continued to expand the possibilities for the cause of the fire; by this point, it was not a housekeeping issue and had to be something wrong within their process.
The analyses and documentation developed within the Seeq workbench quickly brought new people up to speed on efforts. They demonstrated how all the process and field data were applied to address the problem. No indicators demonstrated that something was wrong or had changed. The only commonalities were that breaks occurred before the fire, and the sheet was off the reel when a fire was identified. Washups were performed correctly, and any paper buildup on the framing was minimized.
The Solution
Attempting to step back from the problem, engineering utilized their Seeq resources to expand their data review further by looking at their other machines. The idea was to stop focusing on what the system was telling them and instead look at it from the perspective of how it should behave.
A stepwise approach was taken to identify similar process conditions (period of sheet breaks leading up to sheet off events, similar duration of sheet off events) for the other assets and to review system performance in the same area where the fires occurred. This approach and visualizing the data across multiple machines showed that the hood temperature profile was comparatively inconsistent. It appeared that the temperature of the hood was not being reduced appropriately when the sheet was off the reel.
As the team looked closer at the pertinent systems, the hood temperature remained elevated while the sheet was off, even though other indicators inferred things were working normally. Checking for agreement, the team looked further into system performance and identified that the temperature profile was more aligned historically with the other assets. This realization caused them to recheck other reported data for the affected system. Going through the signals available, temperature change and damper position values demonstrated that the two series were not behaving as they once did.
At the next down, the dampers were inspected again and were found to be failing. While the system was recording damper positioning to be opening and closing as they should, visually inspecting and testing operation found this not to be the case. Once the dampers were repaired, the fires stopped occurring.
Continuous Improvement
As the team did the review closeout, several improvements to the process were noted. While earlier safety investigations did visually inspect the damper system, the documentation did not confirm its operation, only citing if there were any signs of damage and the position readings from the system. Earlier investigations were also focused on documenting what happened and did not question what should have happened. Working collaboratively within Seeq, the team managed review efforts and pinpointed where the data led them astray. Using Seeq more in the future was also recommended. The application use equated to an ~80% IRR, but more importantly, the fires stopped.
The events described here are based on an actual situation. At this time, when more and more data is available, it becomes increasingly difficult to manage and to review everything between different reporting systems to solve problems. Therefore, bringing everything together to understand the story data tells is critical and invaluable.
 1")

