Challenge – How to Establish Improved Product Stability
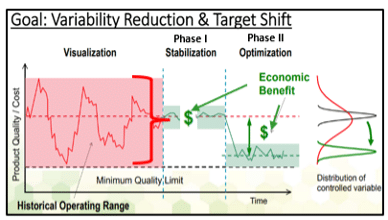
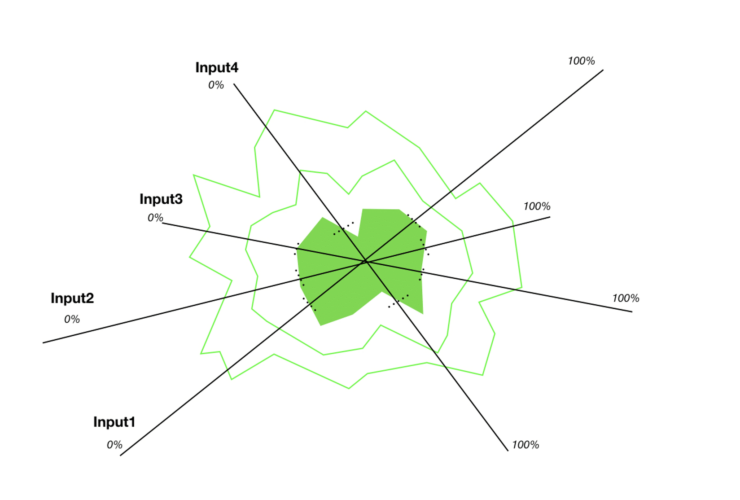
How to establish improved product stability on a containerboard paper machine with far fewer breaks and shorter basis weight transitions? In this hypothetical mill example, the medium mill produces 1,000 tons/day (350,000 tons/year) with several basis weight changes per week. As noted in the chart, PM variability, which in turn causes PM breaks, off-quality production (sold at discounted pricing), or more extended transition changes, was the norm.
As noted in the graph, there are two well-defined phases in every project: Stabilizing the Variability is Phase I, and Phase II Optimizes the process to allow, for example, light-weighting.
Solution – Track Variations in Fiber Properties
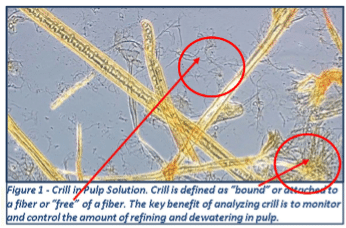
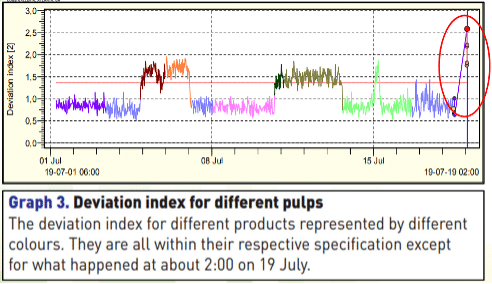
PulpEye’s instruments can track variations in fiber properties that result in changes to finished product physicals while in the pulp slurry itself. While Ring Crush, CMT, STFI, and Freeness values don’t exist until the board is made, PulpEye’s data analysis can correlate changes in pulp properties to end-product physicals. Once detected, values that have deviated from their targeted values, the process can be set to automatically adjust the furnish and refiners to bring the process back into control limits. This is possible through closed-loop refiner controls to increase fibrillation while monitoring and controlling freeness values. Increased refining boosts crill development, increasing fiber-to-fiber bonding.
Crill is the hairy little fibers that are a by-product of refining and plays a large role in strength development. It is the single most significant contributor to strength. Further, numerous variables can be tracked in PulpEye’s system. These variations can quickly be ID and brought back into statistical process control.
Results – Save $2.2MM/year in Production Costs
By applying these tools within PulpEye’s controls system, this mill saved 45 minutes per day, on average, due to machine breaks. This Phase I stabilization equated to $2.2MM / year. Again, these savings generally are from the dry end, calender stack breaks, wet end breaks without wrapped dryers, wet end breaks, and dryer wrap breaks. In this case, the assumption is two daily breaks with 45 minutes of lost production at a cash cost of $200/ton.
Phase I Work = $2.2MM (45 mins/day * 350 days/yr * $200/ton * 1,000 tons/day * 1 hr/ 60 min * 1 day/24 hours)
Phase II Work, which will be covered in an upcoming article, focuses on optimizing the paper machine and will show how light weighting can be achieved. This follow-up article will walk through the key steps to optimize through refining, crill development, fiber-to-fiber bonding, and closely monitoring freeness to acceptable limits. Phase II Optimization as an order of magnitude cost reduction is in the $2MM per year range.

