The most common specification for a sheet of paper is basis weight and moisture. Basis weight is the weight of a sheet per unit area, which includes moisture. The moisture content of a sheet of paper is typically 5% to 8% of the weight of the sheet. In the papermaking process, automated systems use basis weight and moisture measurements as their targets to ensure production meets these specifications.
However, the quality requirements for a sheet of paper are often stated regarding required mechanical properties. Depending on the grade, differing strength requirements such as tensile, burst, tear, ring crush, and others are specified. These requirements can be more important than meeting precise basis weight or moisture targets.
Why doesn’t the industry use these strength specifications for their targets?
The reason is there are no online sensors that can measure strength properties. Therefore, papermakers often make a sheet at a sufficiently high basis weight and low moisture to ensure the strength properties are met. This means the furnish demand to meet a basis weight target and the energy demand to dry a heavier sheet to a lower moisture content might result in higher than optimal production costs.
However, Pulmac can predict these strength measurements with the use of PulpEye. PulpEye data provides important properties of fibers that are very significant in determining the strength of the finished product.
PulpEye data can be combined with other process data in Seeq to derive prediction models of strength properties. These models can find lower basis weight and higher moisture targets that meet the strength specification while reducing operational costs.
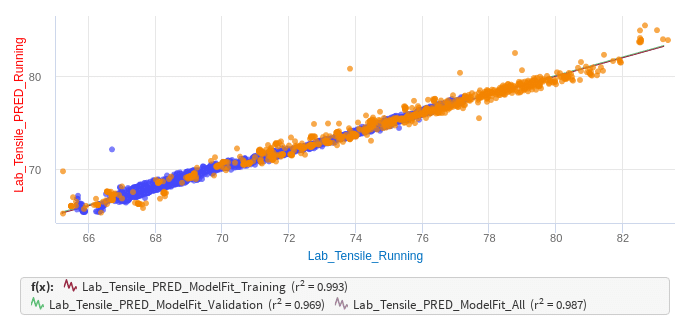
Below is an illustration based on hypothetical data (not obtained from an actual process) in which a prediction model of tensile strength is built in Seeq. The XY plot shows how well the prediction (Lab_Tensile_PRED_Running) compares to the actual lab values (Lab_Tensile_Running). The R2 values are also shown for the training data (blue dots), validation data (orange dots), and all data in the dataset. An R2 value of 1 is a perfect fit, and an R2 value of 0 means the model has no relation to the actual data. The model below shows a very good model fit.
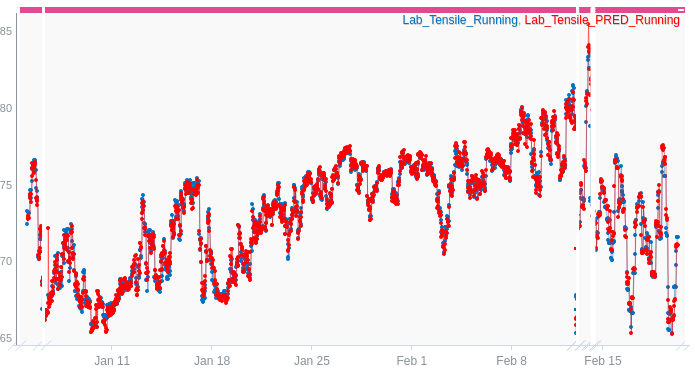
We can also show the accuracy of the prediction model by plotting a time series trend of the actual tensile results from the lab (blue dots for Lab_Tensile_Running) along with the predicted values from the model (red dots for Lab_Tensile_PRED_Running). This is meant to show that the model tracks the change when a change occurs. While there are some cases in which the blue and red dots do not overlap, this does show a good model fit.
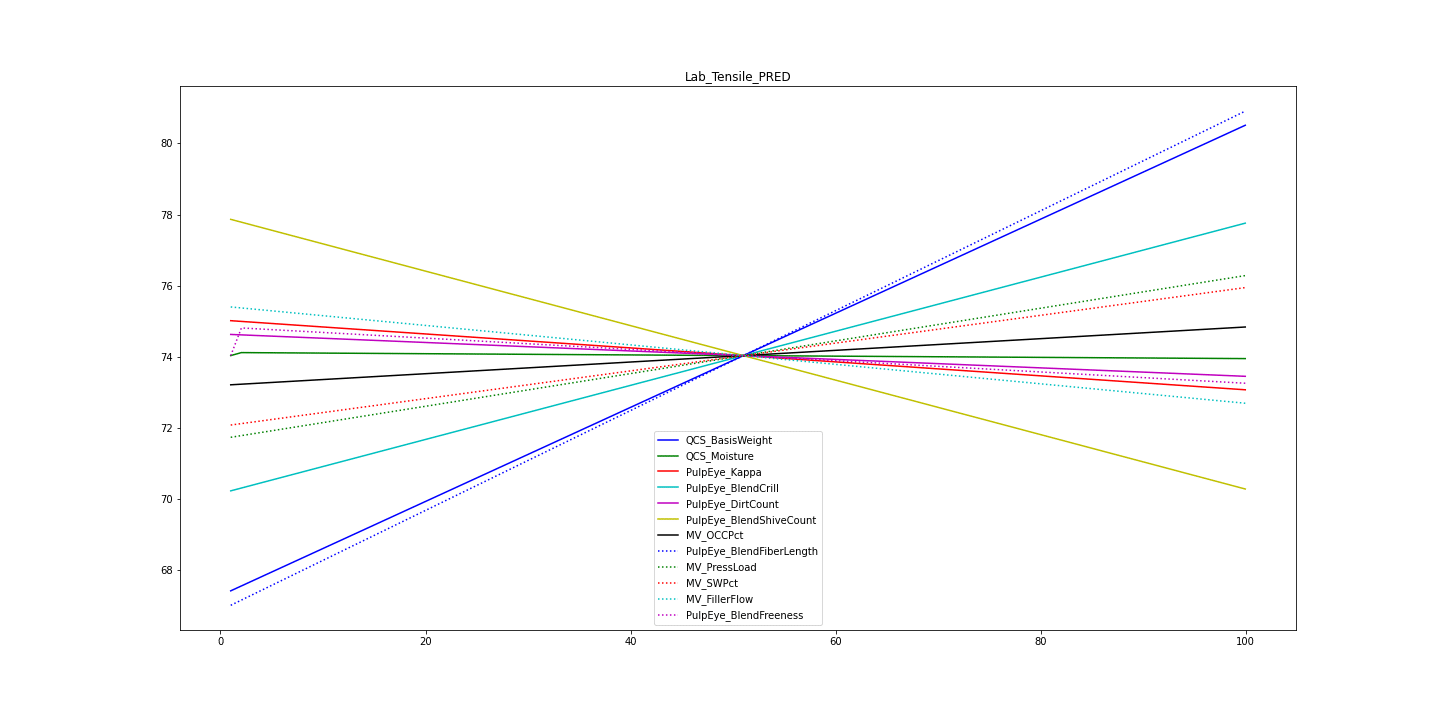
While the plots are impressive, it is important to look at the gains in the model for analysis and automation. These gains show how each input to the model affects the prediction. Below is a sensitivity plot showing these effects. The x-axis is the input range from 0% to 100%. The y-axis shows the resulting predicted value from each input as it ramps from 0% to 100%, with all other inputs held at their mean. From this sensitivity plot, is can be seen that PulpEye_BlendFiberLength (blue dotted line), QCS_BasisWeight (blue solid line), and PulpEye_BlendCrill (cyan solid line) have the most significant positive impact on Tensile, while PulpEye_BlendShiveCount (solid yellow line) show the most significant negative effect.
If PulpEye data is unavailable, the model’s accuracy may significantly deteriorate. If Crill, FiberLength, and ShiveCount are not included in the model, that loss of accuracy may cause a loss of trust in the prediction. While no prediction model will be perfect (there are always unmeasured disturbances), building trust in a prediction model with operations is very important.
Pulmac’s process expertise in papermaking ensures that the significant variables that affect strength are accounted for. A real-time prediction model can be deployed to give operations the information they need to identify swings and drifts from quality targets.
Advanced control techniques can then use these predicted quality measurements to maintain the process at these optimal operating points automatically. While it is possible to adjust basis weight targets through offline analysis of lab data, such an approach would not be able to respond in real-time to changes in furnish quality or process conditions. Automation ensures that the optimum operating conditions are maintained to deliver quality, production, and cost objectives.
While each grade and machine will have unique conditions and differing benefits, a reasonable assumption is that the same cumulate area of the sheet can meet tensile strength specifications with optimally set variables at 0.5% lower basis weight.
Assume a paper machine producing 1,000 tons/day, which is 350,000 tons/year, assuming 350 operating days per year. Assuming a fixed annual demand of sheet area, reducing the basis weight target by 0.5% would save 1,750 tons of fiber. If we presume mills prefer to reduce the most costly furnish used primarily for strength properties, we will assume this reduction is virgin softwood kraft, with a typical price of $900/ton. This is a $1,575,000 annual savings.
PulpEye provides critical information that has previously only been available by analyzing a sample of furnish in a lab long after the product has gone to the reel. PulpEye provides real-time data that can be used to predict product quality for use in an automated solution. Targets such as basis weight can be shifted through automation to meet quality targets while optimizing costs.

