A common challenge in making any grade of paper is to meet conflicting quality targets with optimal economic usage of resources. It can be easy to use a lot of energy, fiber, chemicals, and personnel to meet the targets, but doing so with minimal cost and waste is much more challenging. PulpEye uniquely provides the data that can automate optimal operation.
In this article, we will use the example of a tissue machine. The data used in this article is not taken from an actual process. It is simulated data that represents known relationships and does not violate the usage of any proprietary data.
Premium Tissue Requirements
To make premium tissue, start with the right furnish, then focus on driving tensile down, stretch up, add softeners, and use a ceramic-coated doctor blade on the Yankee to maintain acceptable softness. Here are some typical requirements:
- 80% hardwood, typically eucalyptus
- Drive tensile down to increase softness but not so low as to sacrifice too much strength
- Drive MD stretch up.
- Take moisture from 5% to 2% to 3% moisture. This lowers tensile, increases stretch, and creates a lot of dust.
- Use ceramic-coated doctor blades on the Yankee (vs. metal blades, which wear too fast).
- Use softener chemicals to improve the surface feel.
- Air Drying (TAD) has been shown to give better bulk/basis weight and fiber efficiency, which has resulted in a more porous sheet that has improved absorbency while maintaining strength. One of the downsides of TAD compared to structured tissue is the much higher energy consumption.
Regardless of the mechanical design of the machine, achieving optimal operation requires real-time data and automation.
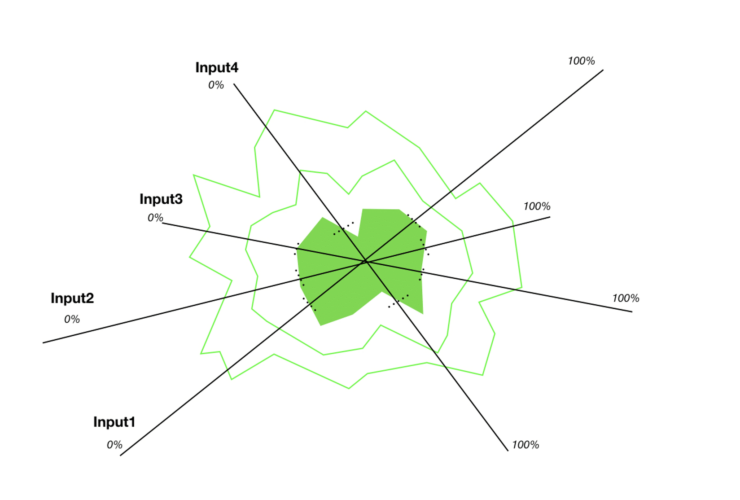
We will use the example of tissue that must meet strength, absorbency, and softness targets, such as the case presented by Zhibin He at PAPTAC 2023 (1). This paper addresses the known conflict that refining can increase strength properties but reduce bulk, softness, and absorbency. The paper focuses on how refining affects these properties in opposing relationships and how chemicals can aid production objectives. Of course, many other operating parameters, such as moisture, weight, press load, jet to wire, and others, can have an impact. The objective to maximize production rate means pushing machine speeds to the limit, which is another factor impacting quality. The result is a multivariable problem that can be complex for an operator.
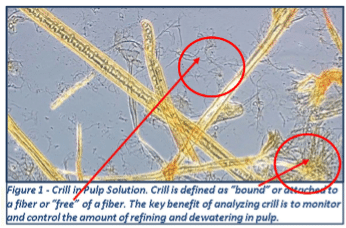
If we are blind to the furnish quality, we will find that any optimal settings will be transient. To have sustainable results, we need to know the nature of the furnish. While freeness is a helpful and universally applied property, it is insufficient to know enough about fibers and contaminants to respond to upsets and swings. PulpEye provides critical information such as fiber length, species proportions, dirt count, shives, and the growing recognition of crill as a critical furnish property. Crill has a massive contribution to strength properties, and without PulpEye, there is no way to know that the inherent bonding strength of fibers has changed.
Adding to the complexity of this problem is the nonlinear nature of many of the relationships. In some cases, linear methods, such as Principal Component Analysis (PCA) can be used successfully if the operating region is narrow enough to remain within the nearly linear range of operation. As paper machines are pushed to cover a wider range of grades, linear models become more inaccurate. The ability to use nonlinear relationships when they are applicable enables modeling to provide accurate predictions that can be used for analysis and optimal online control.
Solution: Data + Pulmac Automation
A data analytics platform like Seeq provides powerful capabilities to combine data from the process (the SCADA or DCS system), QCS data such as weight and moisture, PulpEye data of furnish quality, and lab test results to develop prediction models. This provides how we can understand what contributes to softness and strength to find optimal operating conditions.
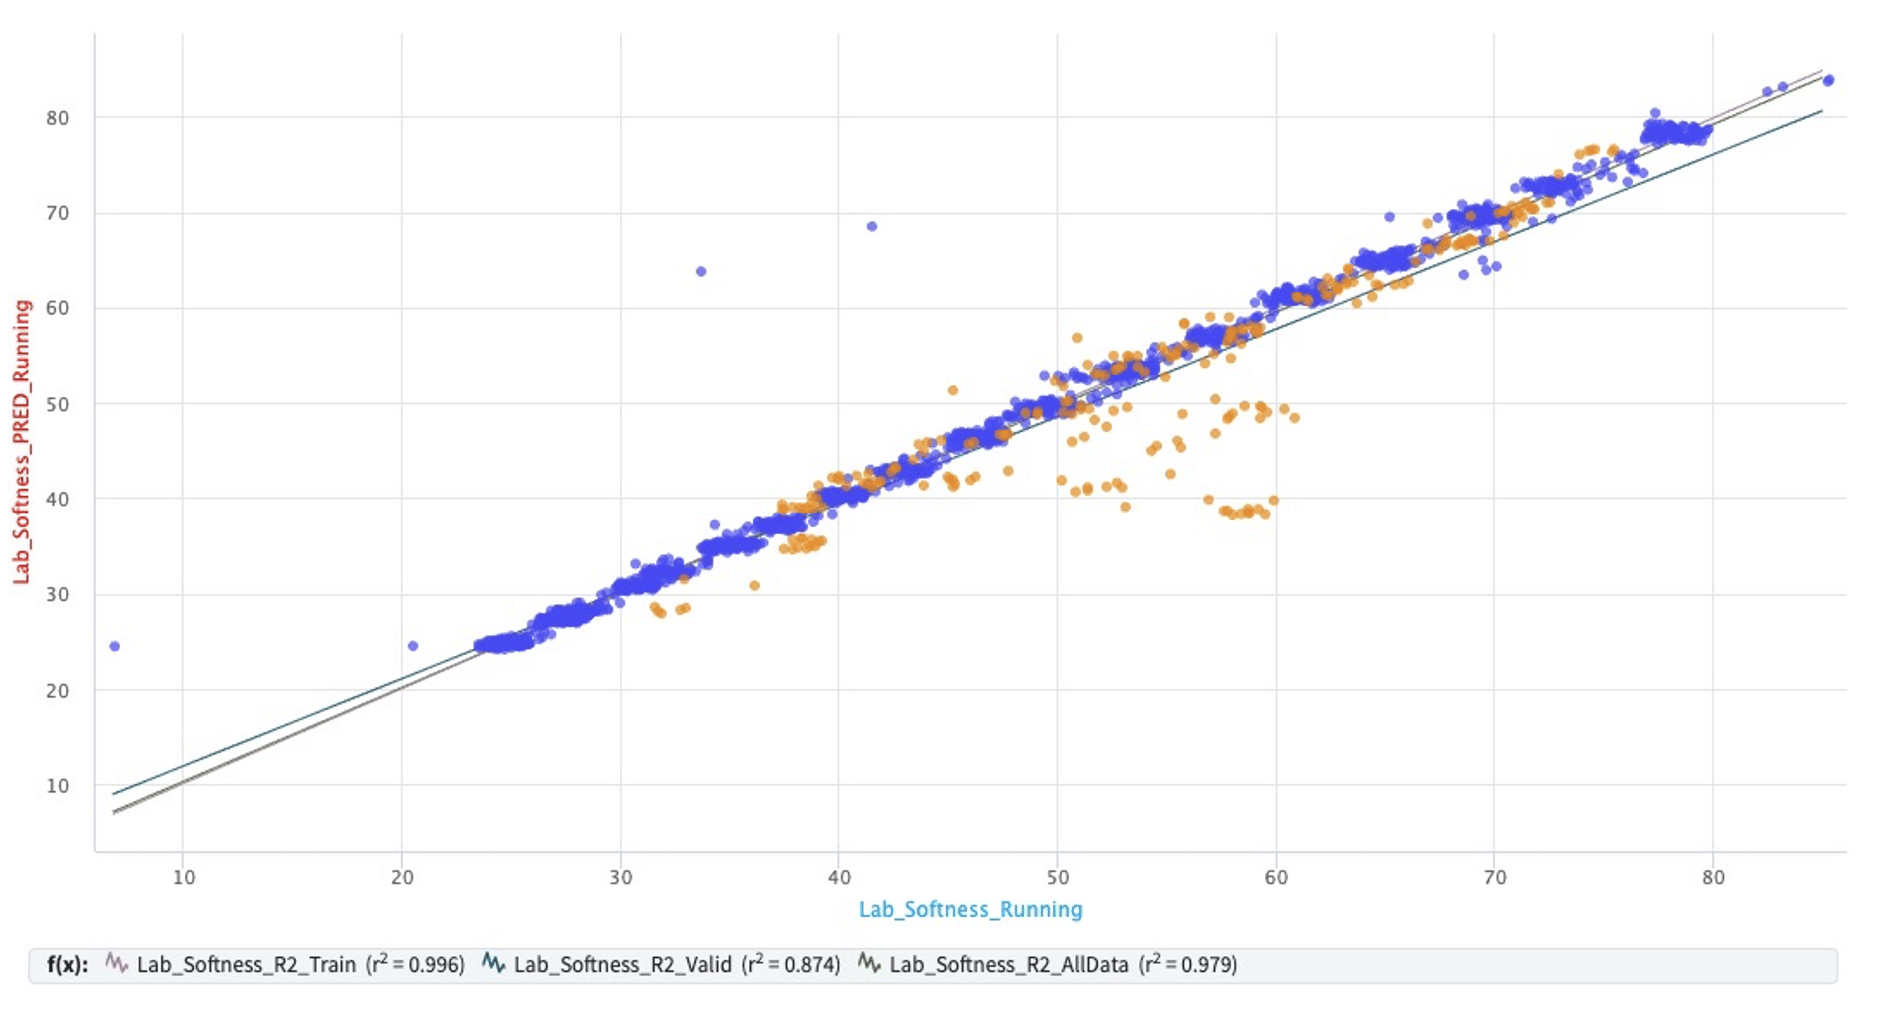
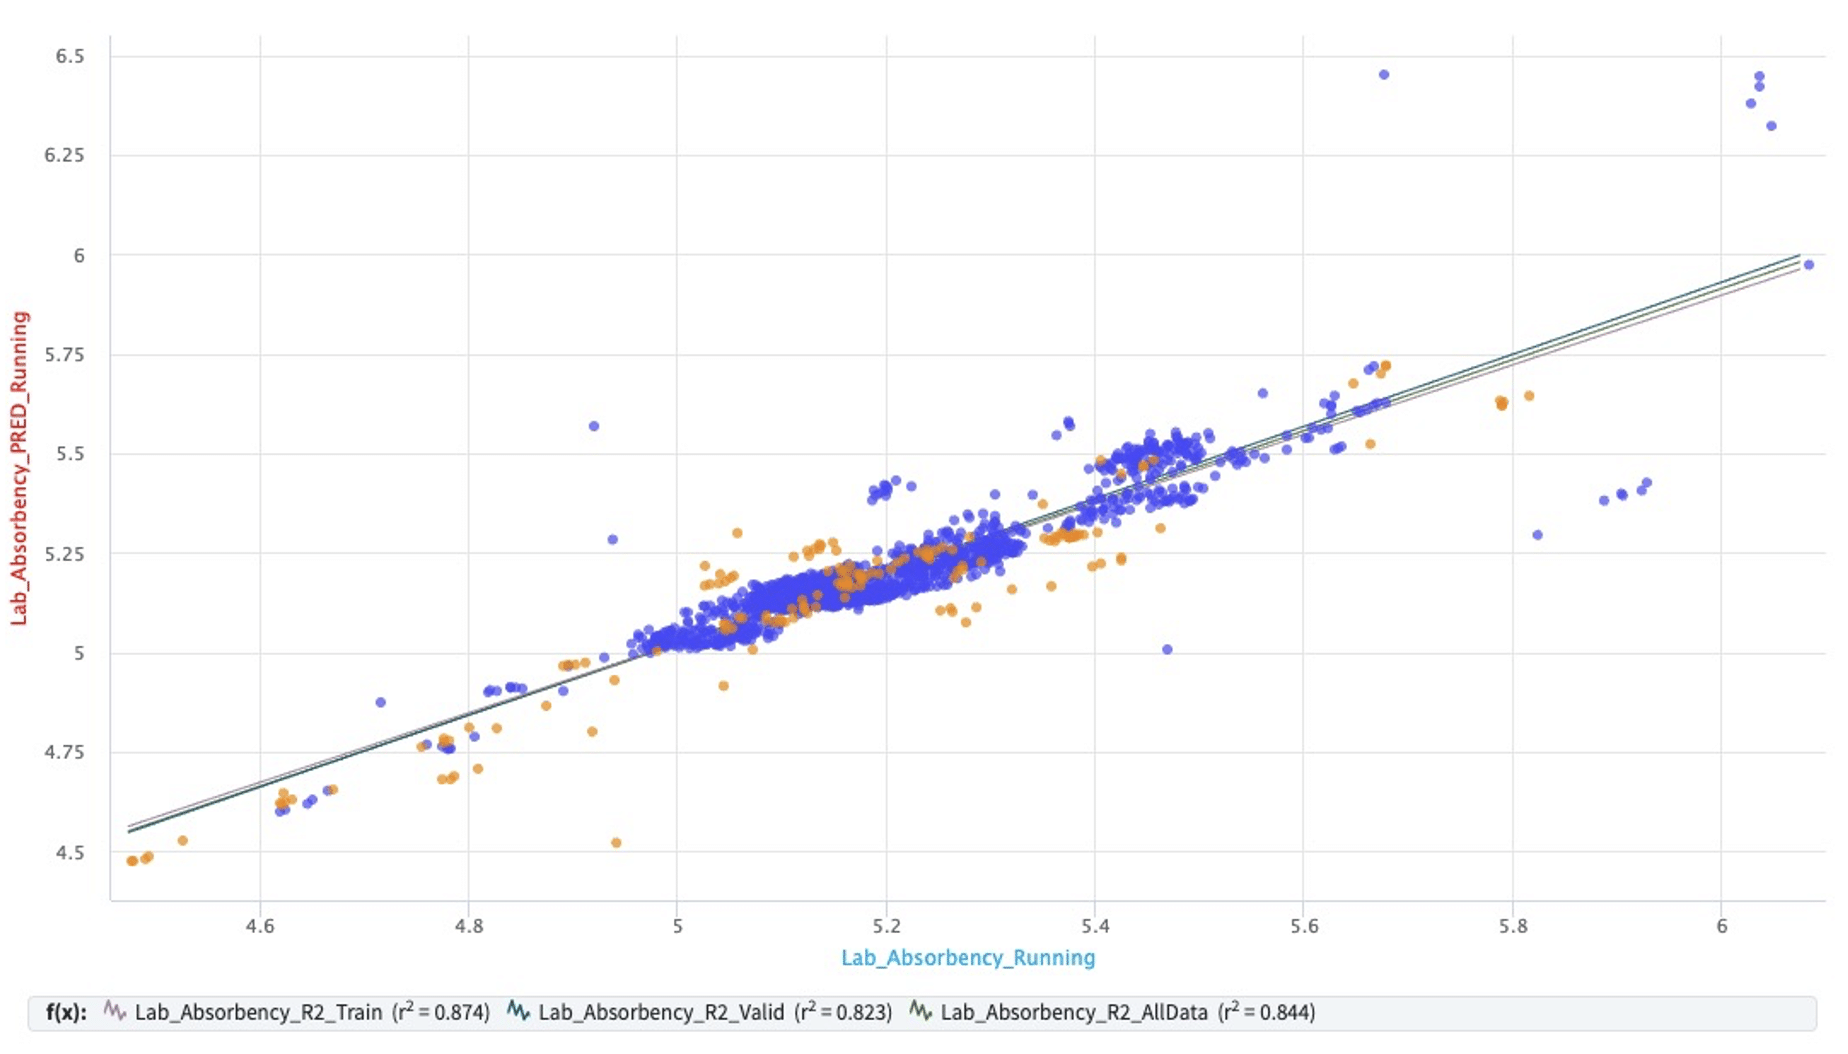
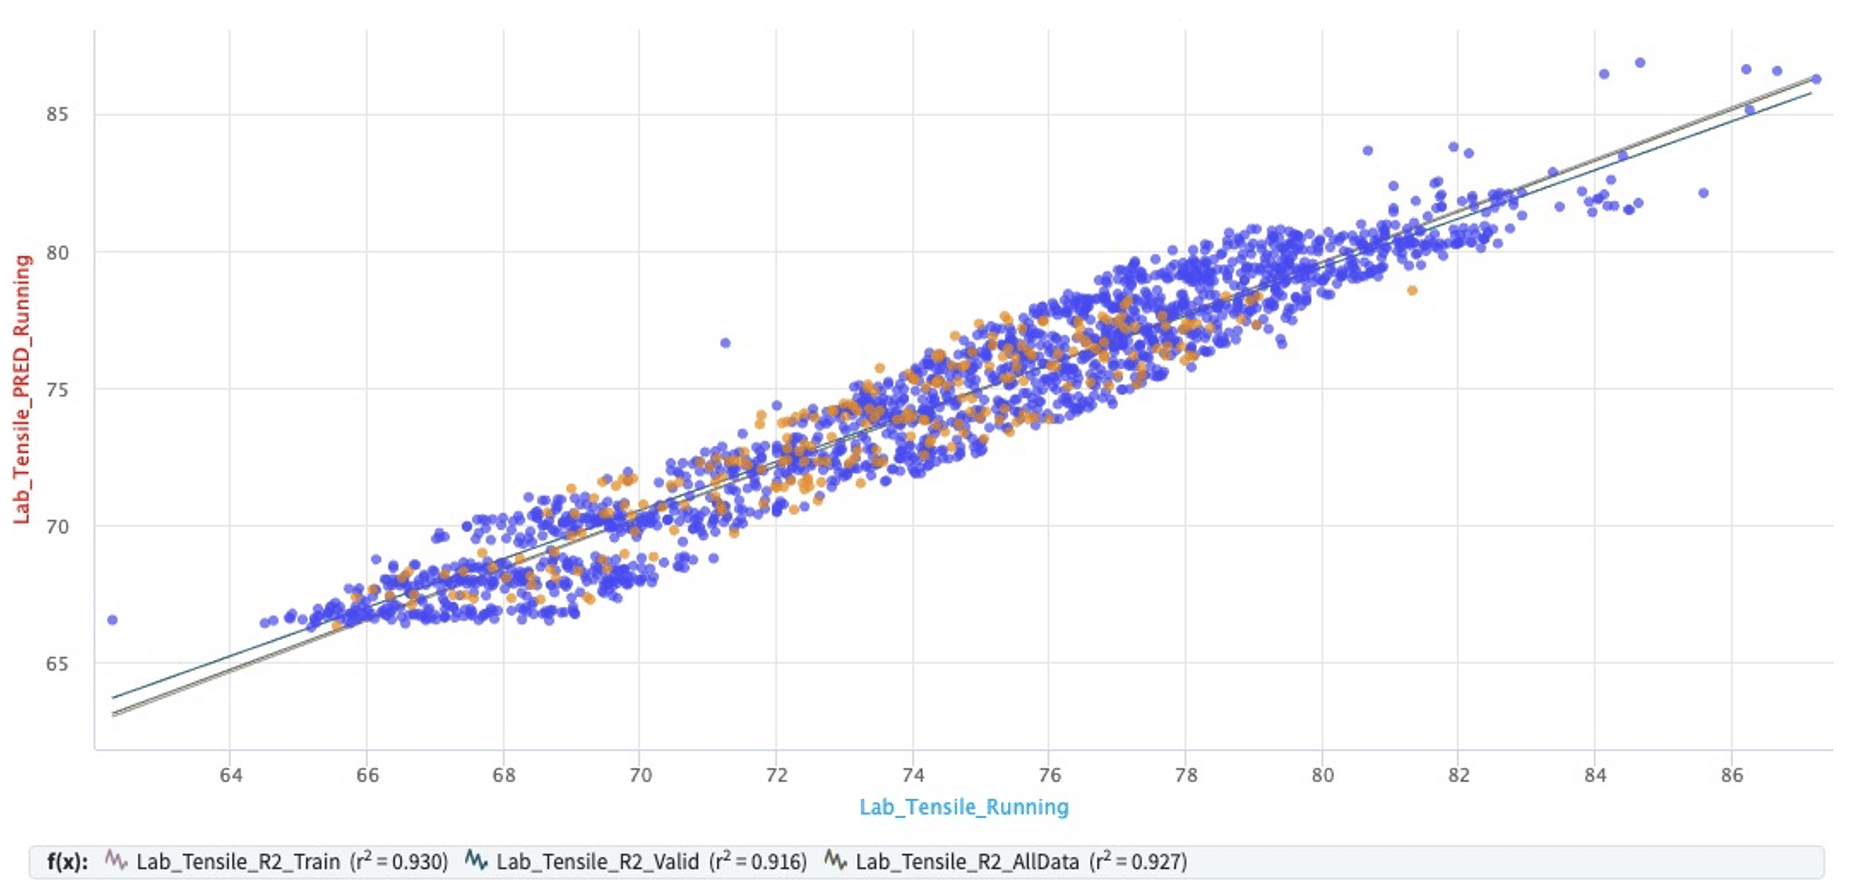
Below are XY plot examples of the actual quality lab tests (X-axis in blue) versus the model prediction (Y axis in red). These plots aim to show how well the prediction model fits the actual lab tests. The data used in this paper is not actual process data. This simulated data (a digital twin) shows the potential benefits of technology applied to this problem. With this simulated data based on first principles and industry experience, we build prediction models in Seeq for the quality objectives of interest. For deployment on an actual paper machine, actual data from the process historian and Laboratory Information Management Systems (LIMS) will replace the simulated data. These prediction models have a training dataset (blue dots) used to train the prediction model, as well as a validation dataset (orange dots) that show how well the model predicts lab quality tests that it hasn’t seen. The R squared (R2) values for each dataset (training, validation, and all data) are shown below the plots. We see that there are outliers that can represent errors in lab tests, and a band of error that represents process noise, yet the model fits are very good.
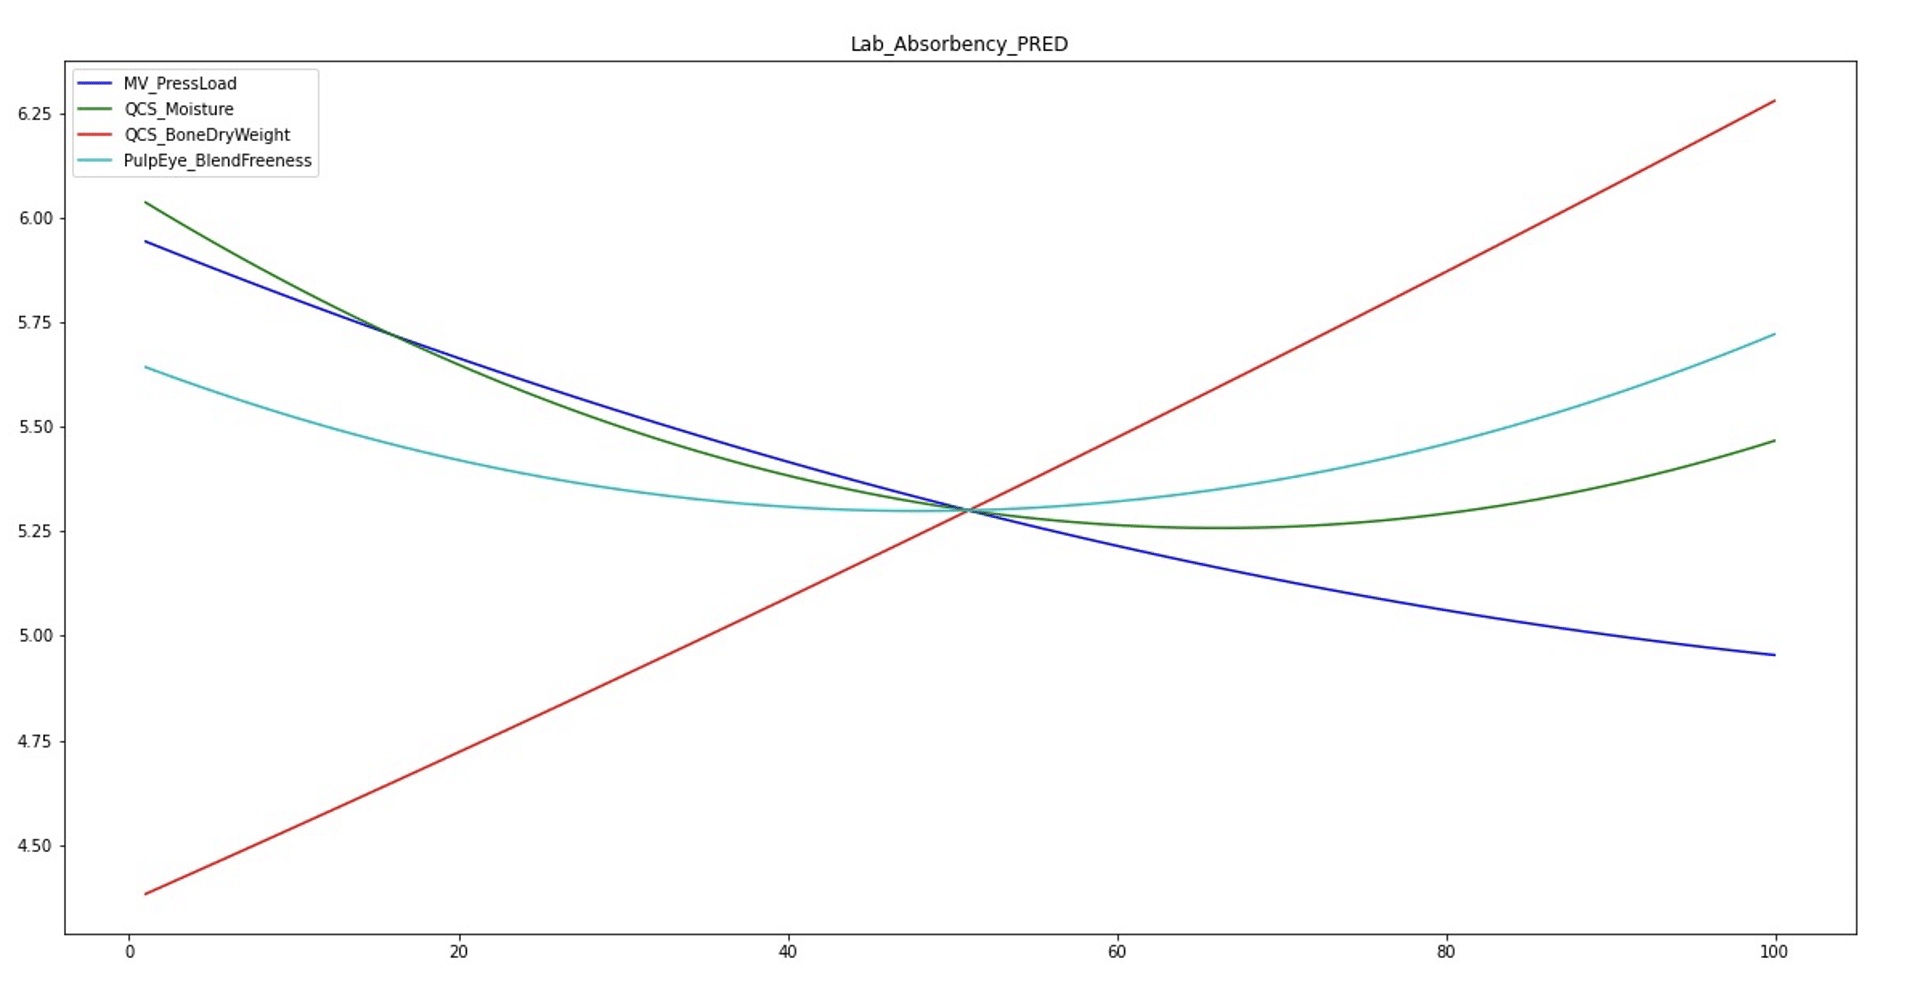
This alone only helps us predict an outcome but does not show how these outcomes occur. We need to know the relationships that yield these results for optimization and automation. This means that the gains in the model need to be analyzed. Below are sensitivity plots for these models that show the gains being used. Of course, since this is simulated data, the nature of these models (inputs, gains) will depend on the details of the paper machine.
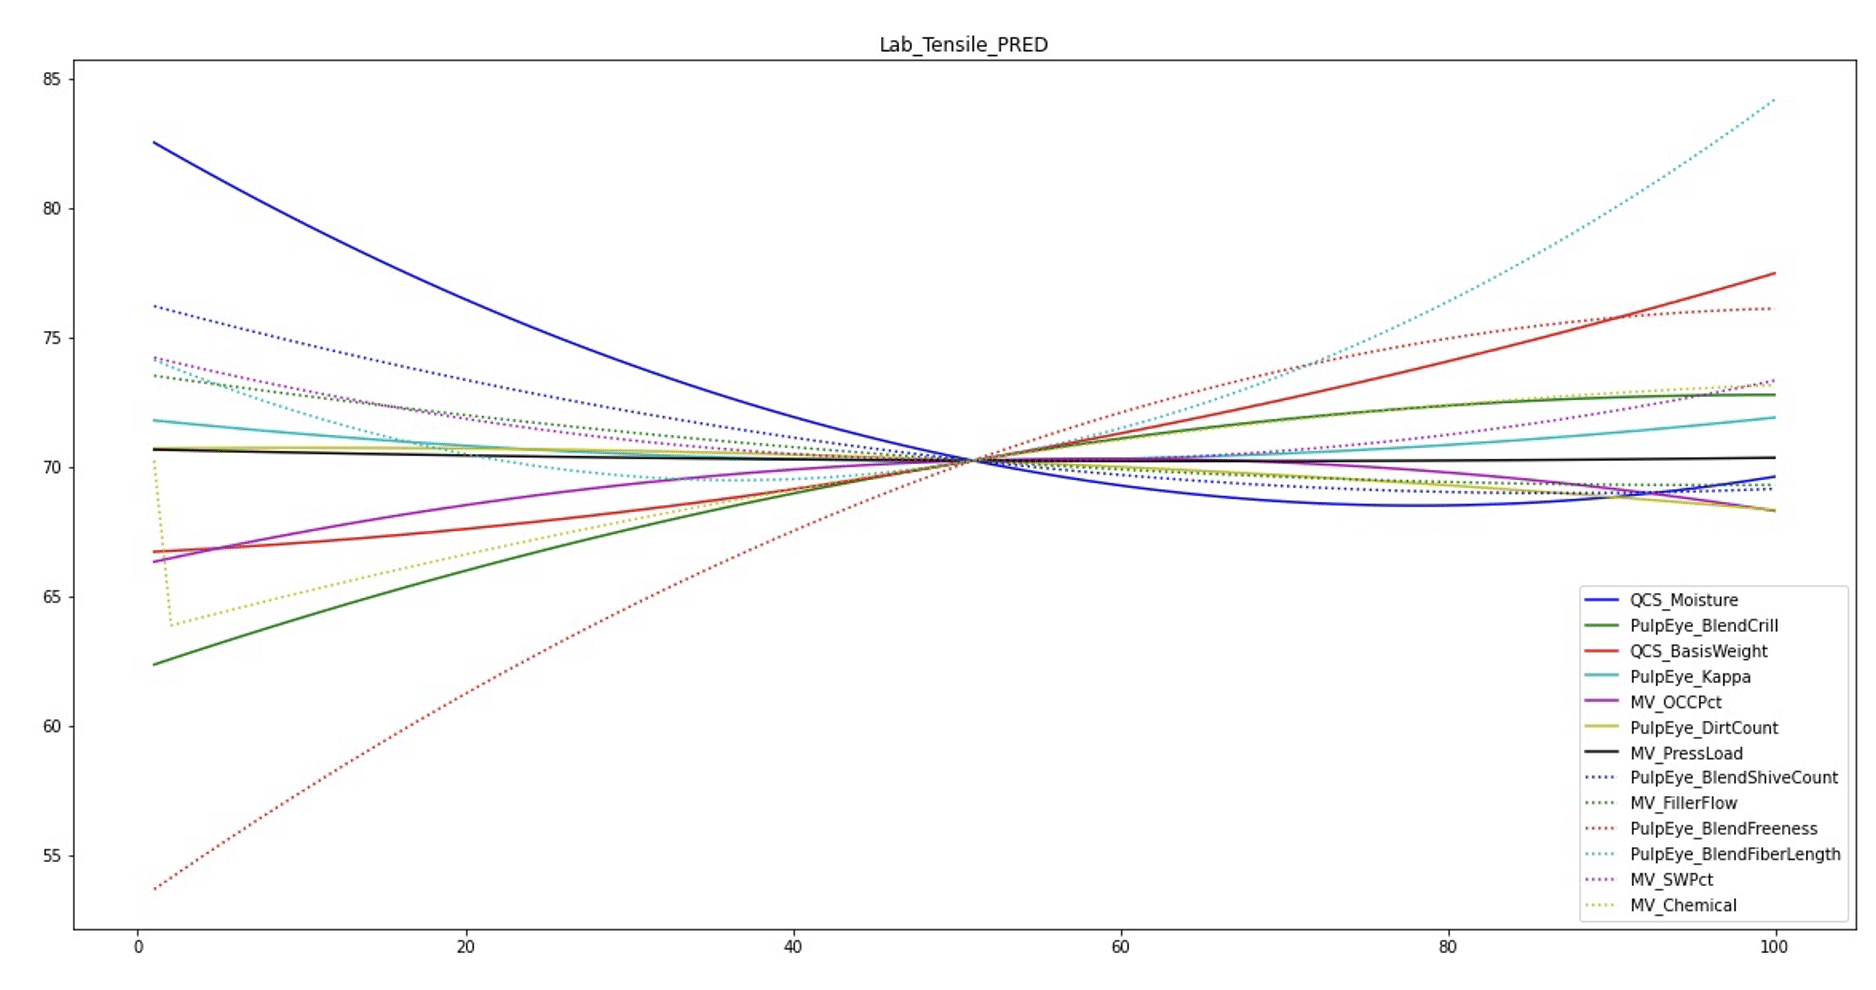
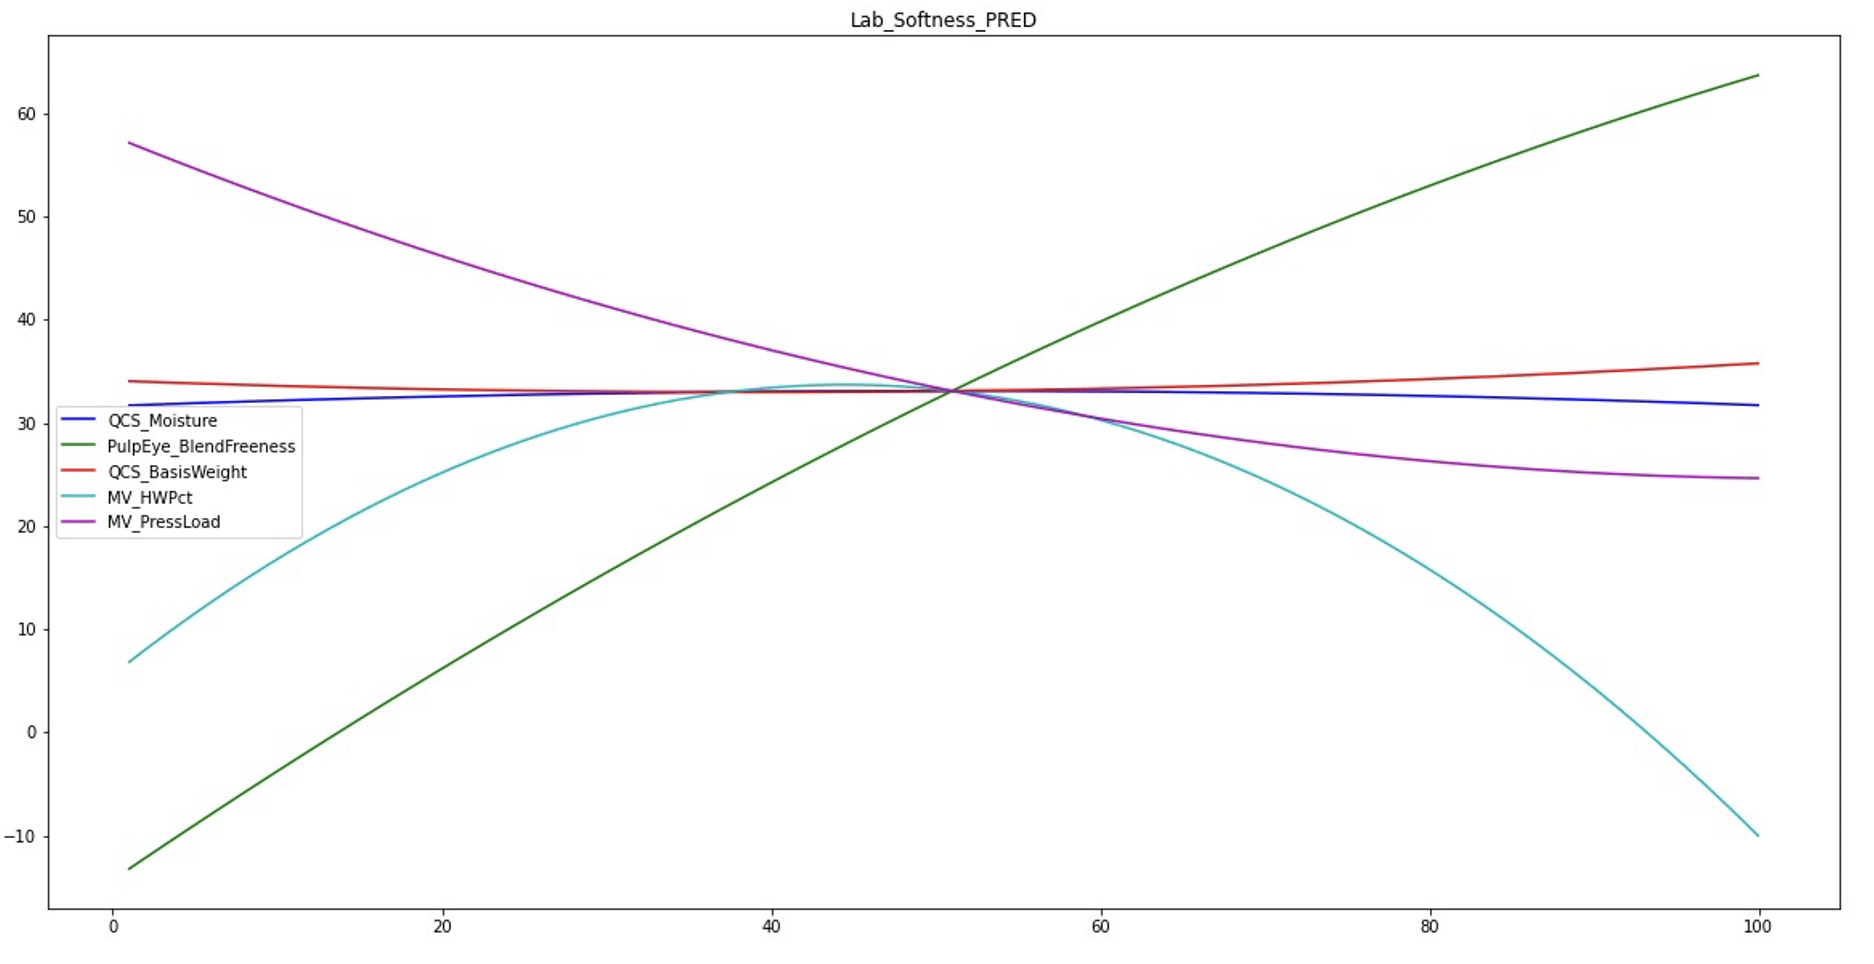
Several relationships are significantly nonlinear. In the Tensile Model, we see the red line for the effect of QCS_BasisWeight has a significant positive slope that is linear, which is expected. The blue QCS_Moisture gain is negative but diminishing as moisture gets lower, meaning there is a flattening of the curve because there is not much change in tensile if a very dry sheet gets dryer. Capturing this nonlinear relationship helps us achieve high prediction accuracy.
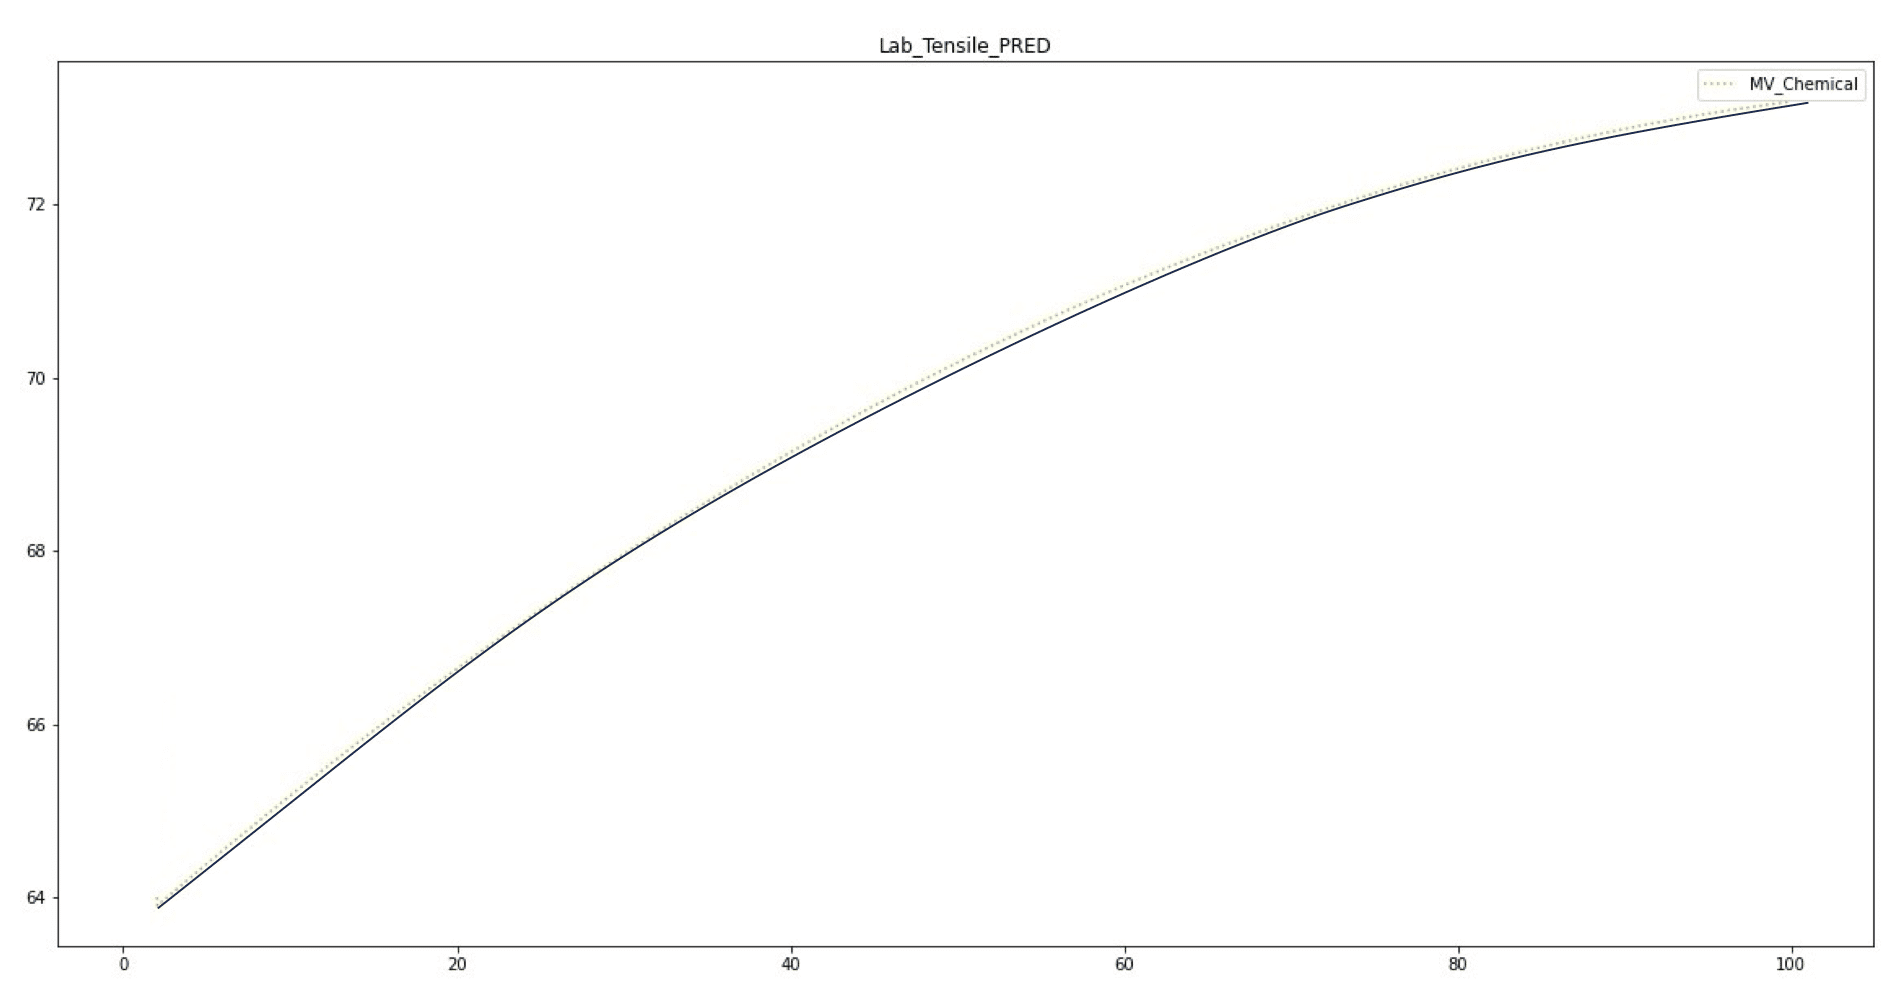
These plots can be difficult to interpret with all model inputs combined, but individual plots, such as the impact of a chemical on tensile, easily show the relationship. As we expect, this chemical has a positive yet flattening nonlinear gain as we approach 100% of its flow.
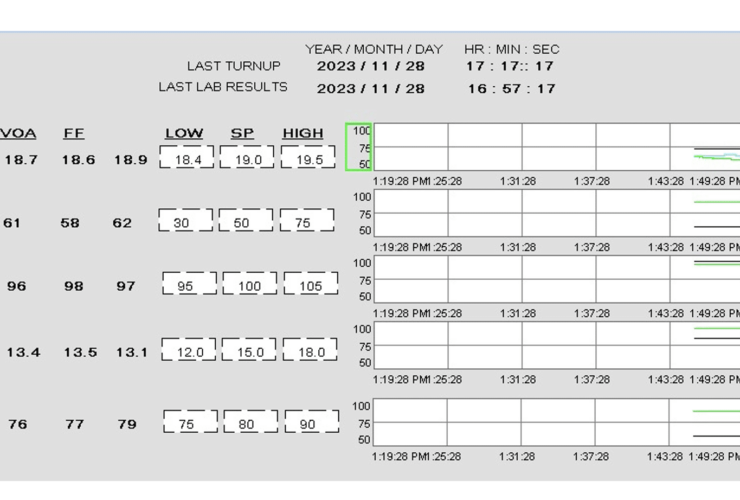
The last step is to use these models in automation. The model predictions can provide virtual online analyzers (VOA) in real-time so that we don’t need to wait until production has been made for lab tests to identify quality problems. This means a VOA can be used in a control loop but must be a dynamic model. Inputs to a model are at different process stages, meaning there are delays (dead-time) and lags. Control loops require dynamic models to make proper feedback responses.
A traditional set of Proportional Integral Derivate (PID) loops will not do. What is required is Multivariable Predictive Control (MPC). MPC provides the following benefits:
- All target objectives (Tensile, Softness, and Absorbency) ensure we meet all targets. Since we know from experience that Tensile and Softness are inversely related, MPC can solve the problem of meeting conflicting objectives.
- MPC comprehends the interaction of all inputs to understand when a swing in freeness, fiber length, crill, or other property will impact the quality objectives
- MPC is a dynamic controller that understands the delays and lags of the process so that stable control moves are made
- MPC is an optimizing controller. It has an objective function that calculates the costs of resources and can prioritize targets to ensure the quality objective is met with optimal economics.
- While MPC has had a history of declining performance as models and tuning no longer reflect what was observed at commissioning 18 months ago, modern technology with artificial intelligence can automatically adapt to maintain performance at a high level.
The Economic Benefits For The Mill
Typical economic benefit from the combination of model predictions, VOA, and MPC automation can be 5% lower costs, which often means recurring benefits over investment 6 months after commissioning. Of course, this result will depend on the particular paper machine under consideration.
Optimizing your operation, regardless of grade, requires combining process knowledge, real-time data, and the people who can combine these to provide a sound solution. Let Pulmac be your partner in optimizing your operation.
Resources:
PAPTAC 2023, “Approaches to Overcome the Conflict of Strength and Softness Tissue Paper by Optimizing Fibre Properties”, Zhibin He, UNB (University of New Brunswick)

