Spectro…what?
No, I am not talking about chasing ghosts, I’m talking about spectroscopy and its use when analyzing and controlling each stage of the pulping process.
One of the challenges in chemical pulp production is to be able to analyze and to control each stage of the pulping process. As we all know, the “liquor” generated is a complex combination of chemicals, solids, and dissolved compounds that are quite hazardous, so proper safety precautions must be maintained. This does create barriers to test as frequently as we would like since understanding the various liquor compositions gives operators insights into process performance and avenues for improvement, ultimately reducing costs.
Typically, a full analytical workup takes more time and resources than we usually have available at mills. Luckily, some of the same analytical techniques we have needed external labs for can now be employed within our process today. One technique is called Near-Infrared Spectroscopy (NIRS).
NIRS is very useful in dealing with complex materials as the technique can easily penetrate samples because of the portion of the electromagnetic spectrum selected. NIRS is already used in a variety of other industries such as:
- Agrochemical Quality Control
- Astronomy
- Combustion Products
- Cosmetics
- Food Science & Quality Control
- Medical
- Pharmaceutical
- Polymer
- Textile
And since so many industries are using the technology, there are quite a few applications for it at mills today, but I’m going to focus on pulping liquors.
In 1988/1989, SAPPI scientists are credited as outlining and successfully demonstrating the first practical application of NIRS in the pulping industry for Kappa number. Since that time, continued interest and efforts have persevered with over 500 research papers published focused on NIRS and wood by 2014 and reaching almost 1500 papers today.
How does it work?
NIRS uses the 700 – 2500 nm part of the electromagnetic spectrum to measure the vibrations of materials exposed to specific wavelengths of light then applies Fourier Transformations to decipher what the chemical compound is.
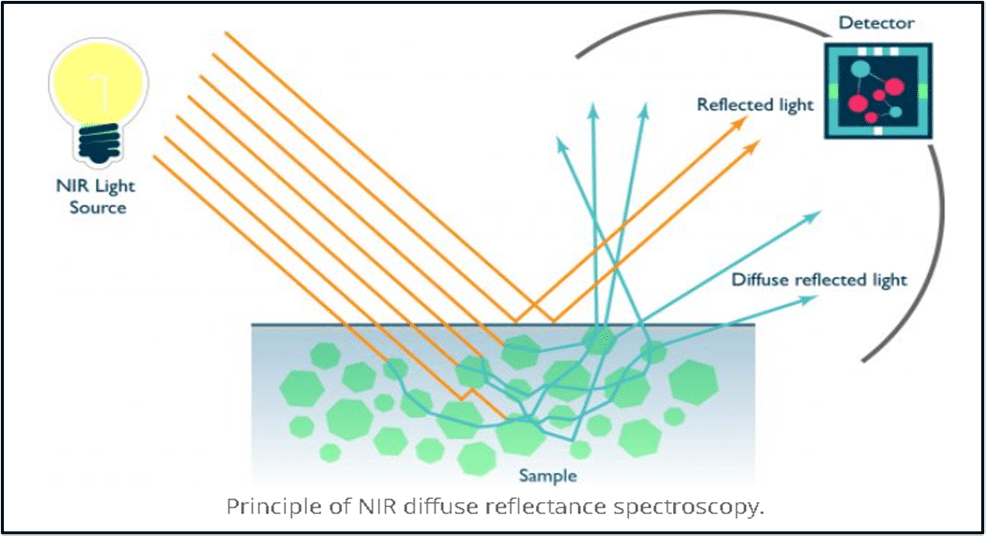
To start, I’ve found a good representation of NIRS from an old issue of Pulp & Paper Canada.
Like many measurement methods, NIRS requires a source emitter and a detector. The source emitter is directed at the sample and exposes it to light. While some wavelengths are reflected off the sample surface, the molecules within the sample become excited by the remaining wavelengths and vibrate. This results in diffuse reflected wavelengths being created. Throughout all of this, the detector is registering all the absorption wavelengths that are modified from the exposure which identifies a unique signature for each of the chemical/biological components.
Now two terms I want you to remember: overtones and combination band. These two terms describe the vibration effects on the molecules that make up the unique signature I mentioned previously.
Overtones are used to describe molecule vibrations from the ground state to any level above the first level of excitation. They can occur multiple times for the same molecule within the NIR spectrum, but each time exhibiting a slightly different absorption response.
If you haven’t already guessed, combination bands are observed when two or more fundamental molecule vibrations occur simultaneously. There are various underlying reasons why they occur that I won’t go into here, but suffice it to say that they are an equally important piece to identifying every compound’s unique signature.
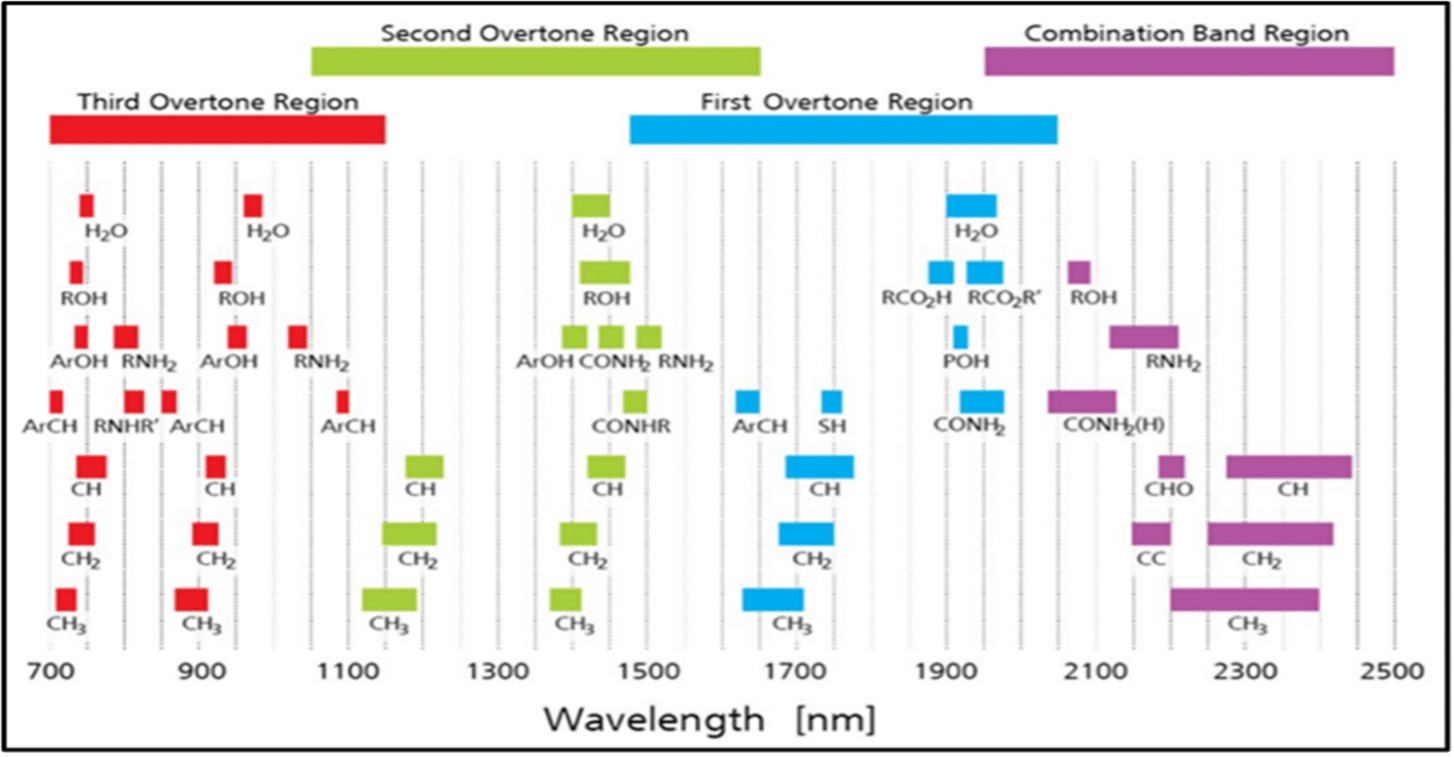
Below is a figure by Alyson Lanciki included in some blog posts during 2020. I have found them to be interesting and invite all of you to review them further for yourselves.
Benefits of NIR spectroscopy: Part 1
Benefits of NIR spectroscopy: Part 2
Benefits of NIR spectroscopy: Part 3
Her figure demonstrates overtones and combination bands for a variety of molecules to show examples of how unique responses can be.
I like to think about the above like church bells. Some church towers have as many as sixteen bells that can be rung together, though six or eight bells are more common. The highest pitch bell is known as the treble, and the lowest is the tenor. You immediately hear the first set of the bells; and while you still hear that first set, a second distinctive note dominates. Yet as the melody continues, you can still hear the first set.
In a similar fashion, each chemical has a distinctive base note (fundamental) followed by 1st, 2nd, 3rd, and sometimes a 4th (i.e. overtones and combination bands).
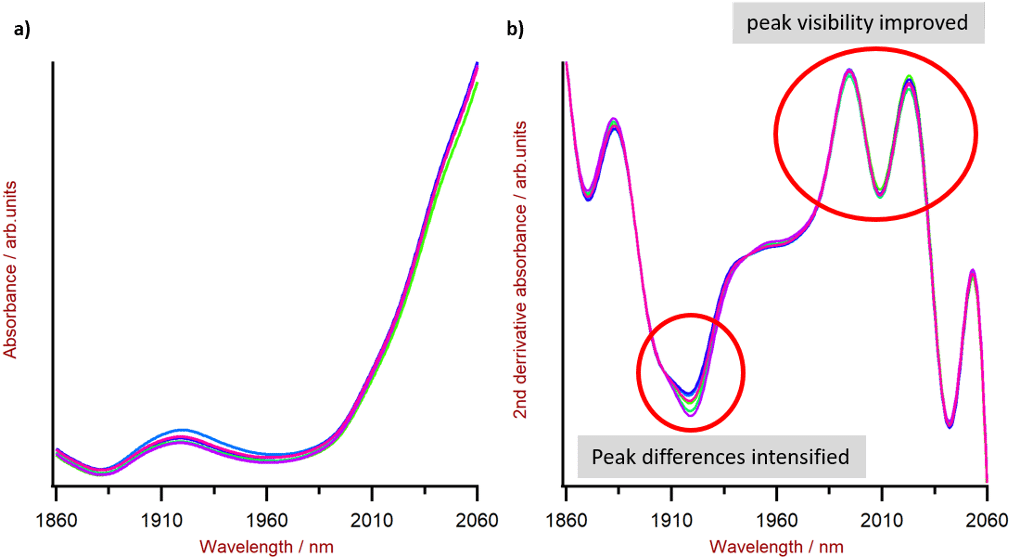
I mentioned that NIRS uses Fourier Transformations to identify compounds. I’m just going to touch upon that briefly using another chart from Lanciki’s blog.
The results above demonstrate why Fourier Transformations are applied to NIRS. The same substrate is tested with chart a) not applying the transformation while chart b) has the transformation. In short, the peaks’ visibility is improved while differences are intensified.
So how does this help me?
We all know that lignin, cellulose, hemicellulose, et cetera, all vary by species, as we’ve experienced working with the different kinds of wood at our mills. So, we all are likely managing how those different wood types enter our process to promote stability. Suppose we’re doing those things, and now there is the opportunity to apply NIRS in the process. What about taking statistical process control fundamentals and applying them with the measuring equipment available today, like RedEye?
Download Dave’s Presentation From PEERS here.
Our services and solutions are tailored to meet the diverse needs of our industry. For those who are curious to explore further or wish to dive deeper into Pulmac’s offering, simply click here to start a conversation and discover how we can assist.

